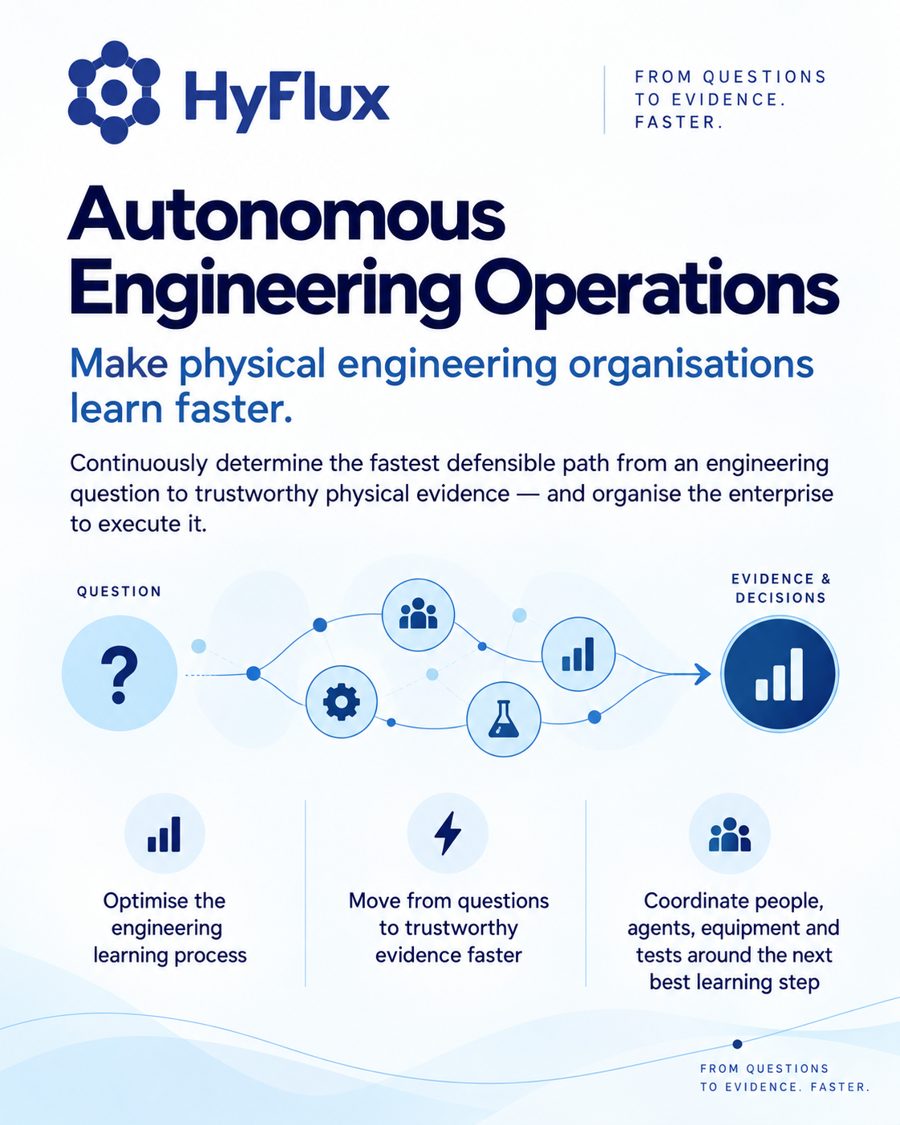
Autonomous Engineering Operations
Make physical engineering organisations learn faster.
Continuously determine the fastest defensible path from an engineering question to trustworthy physical evidence — and organise the enterprise to execute it.
Optimise the engineering learning process
Treat every question, test, supplier, rig and decision as one connected graph and optimise the sequence, not the individual task.
Move from questions to trustworthy evidence faster
Compress non-active time — queues, waiting, re-work — while keeping every mandatory inspection, commissioning, review and physical test intact.
Coordinate people, agents, equipment and tests
Organise the enterprise around the next best learning step. AI proposes, evidence substantiates, policy authorises, humans decide.
Choose your path
Pick the closest description. Each path opens the demo with a guided route through the right modules.
Programme leader
Can the next engineering decision be reached sooner, and what would it take? Control room → FLOW → OPTIMISE → GATE.
Open guided demo →Engineer / test lead
Get an article test-ready and turn a run into accepted evidence without losing provenance. TWIN → RIG → TEST → DATA.
Open guided demo →Assurance / certification
Are the controls real, separable and auditable? TRUST → GATE → CONTROL → DATA, including what is deliberately not claimed.
Open guided demo →Investor / partner
What is real today, what is modelled, and where the compounding asset is. Control room → FLOW → LEARN → TRUST.
Open guided demo →Just exploring
Walk one complete learning loop in about ten minutes: propose, approve, commission, test, verify, decide, learn.
Open guided demo →Team member or administrator
Sign in with a one-time code or Microsoft Entra ID. Roles flow Super Admin → Org Admin → Project Manager → Team, and administrators manage people and projects in the console.
Sign in →The demo and the control room are the same application. The demo keeps state in your browser and has no model connection; the control room persists state for the team and routes the Copilot to a local model on HyFlux hardware or to Z.ai, xAI, OpenAI or Anthropic — never with keys in the browser.
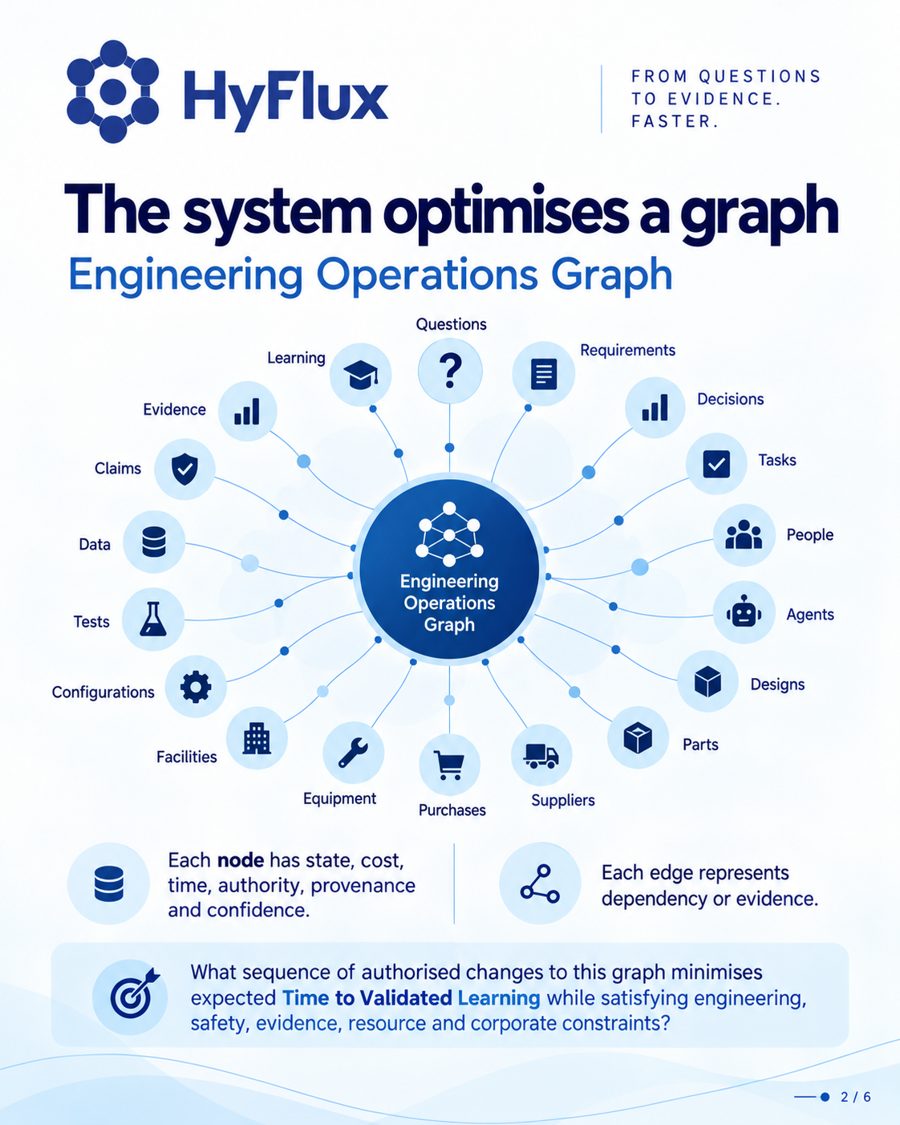
The system optimises a graph
The Engineering Operations Graph
- Questions, requirements, decisions, tasks, people, agents, designs, parts, suppliers, purchases, equipment, facilities, configurations, tests, data, claims, evidence and learning are all nodes.
- Each node carries state, cost, time, authority, provenance and confidence.
- Each edge represents dependency or evidence.
- The question the system answers: what sequence of authorised changes to this graph minimises expected Time to Validated Learning while satisfying engineering, safety, evidence, resource and corporate constraints?
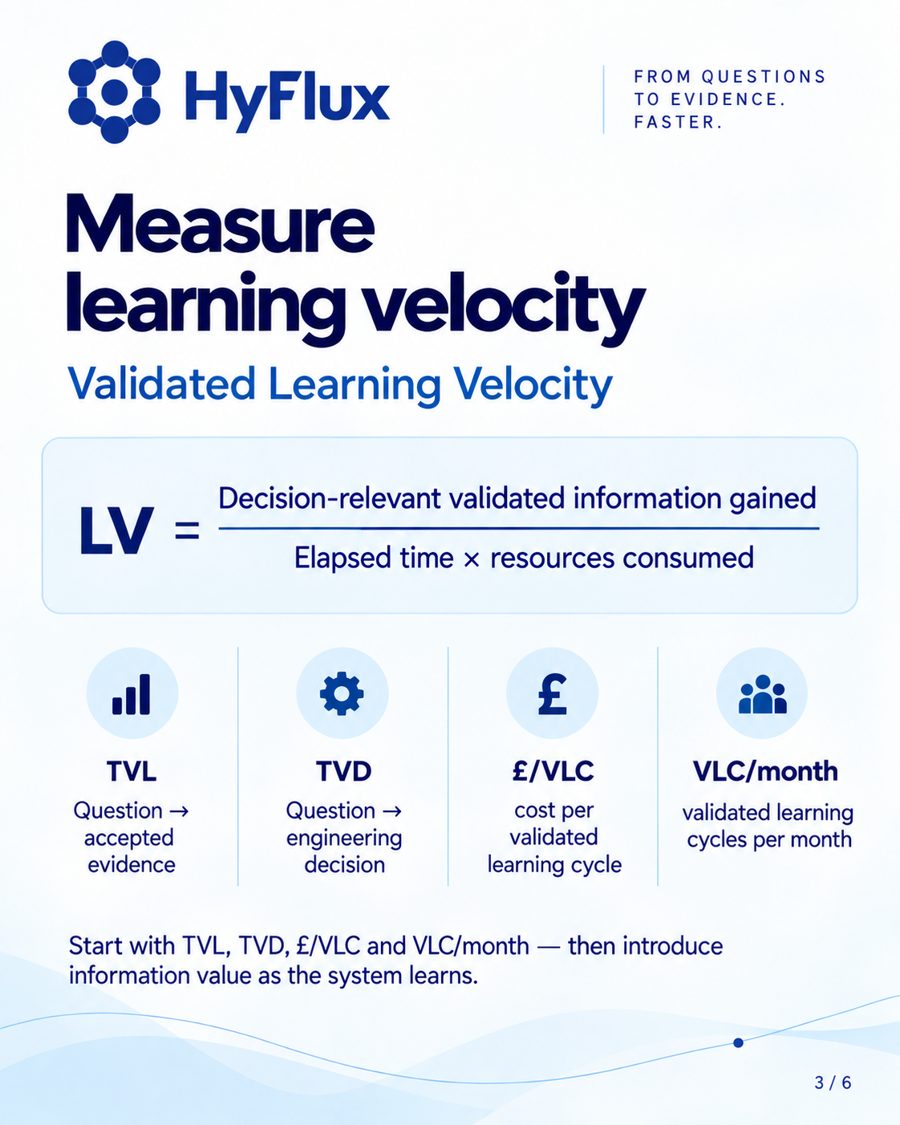
Measure learning velocity
Validated Learning Velocity
Start with TVL, TVD, £/VLC and VLC/month — then introduce information value as the system learns.
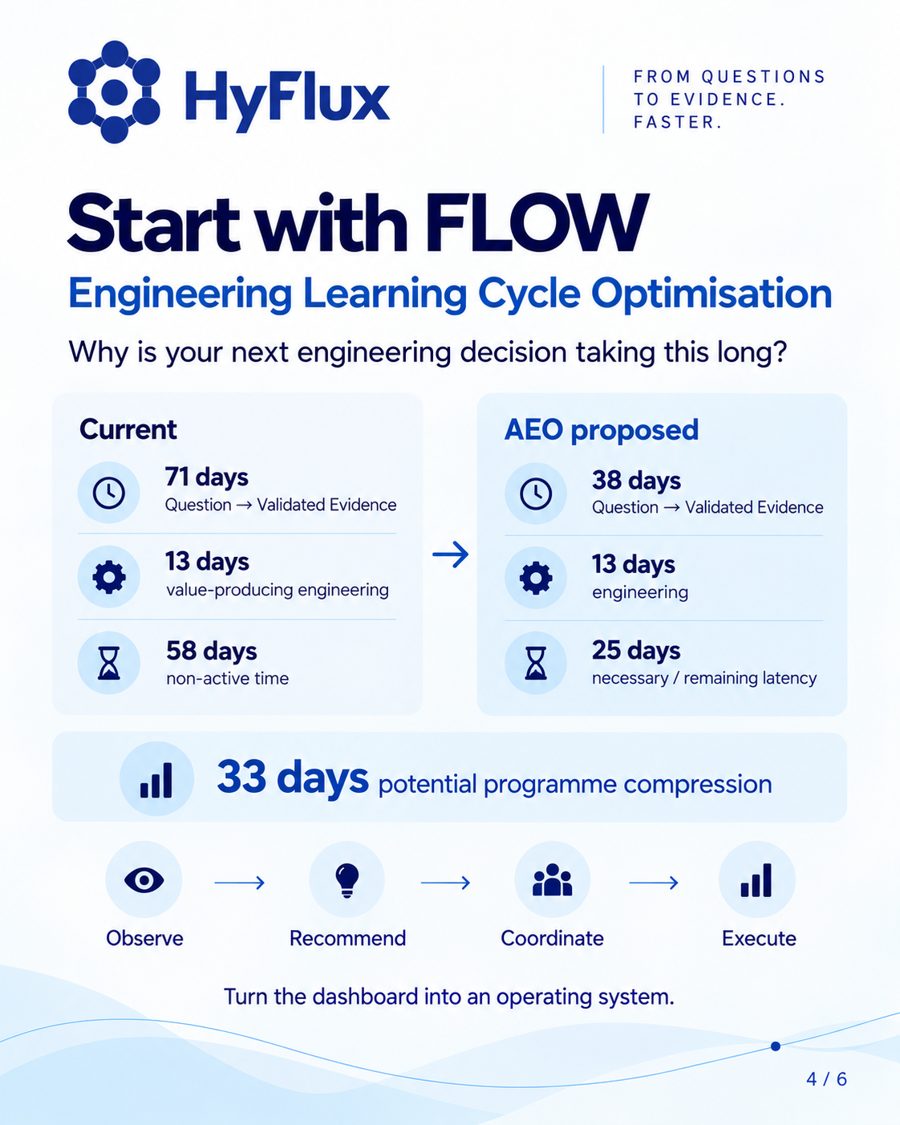
Start with FLOW
Engineering Learning Cycle Optimisation — why is your next engineering decision taking this long?
Current
AEO proposed
Turn the dashboard into an operating system.
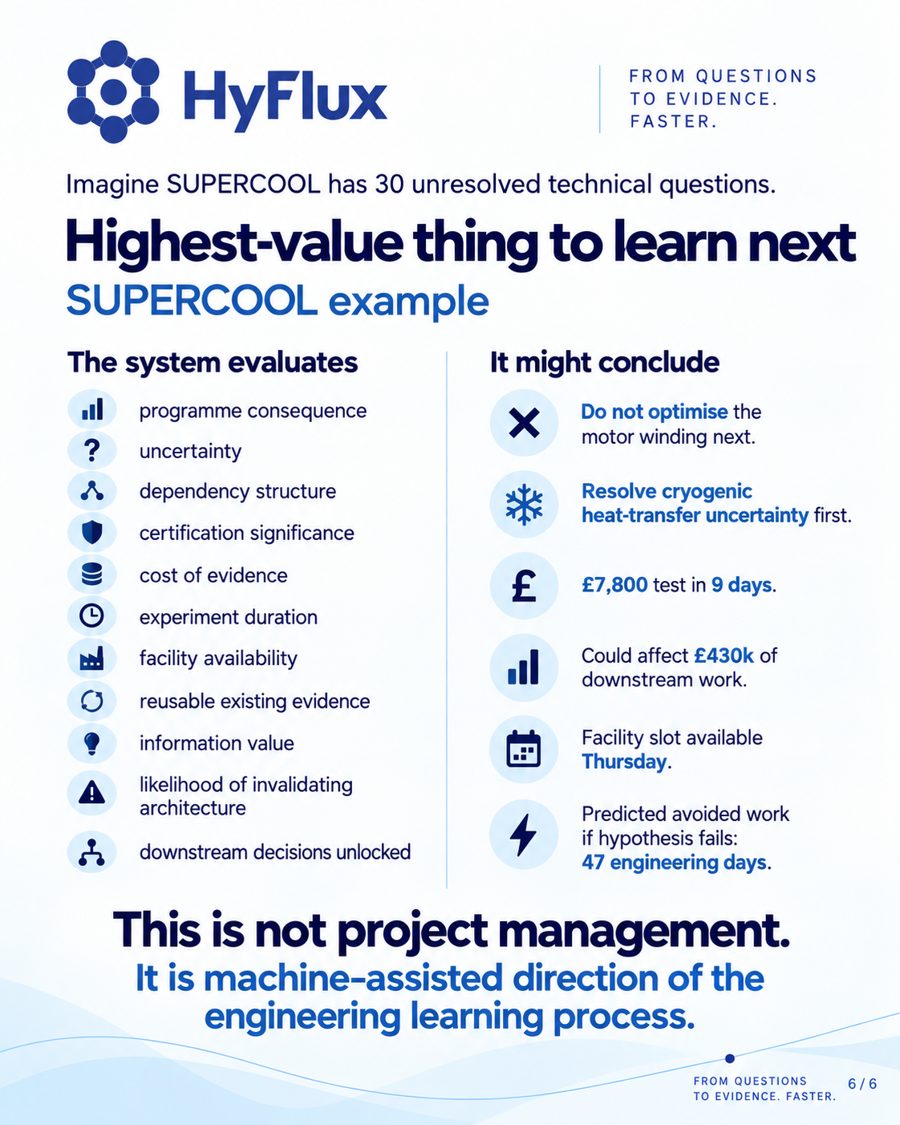
Highest-value thing to learn next
Imagine SUPERCOOL has 30 unresolved technical questions.
The system evaluates
- programme consequence
- uncertainty
- dependency structure
- certification significance
- cost of evidence
- experiment duration
- facility availability
- reusable existing evidence
- information value
- likelihood of invalidating architecture
- downstream decisions unlocked
It might conclude
- Do not optimise the motor winding next.
- Resolve cryogenic heat-transfer uncertainty first.
- £7,800 test in 9 days.
- Could affect £430k of downstream work.
- Facility slot available Thursday.
- Predicted avoided work if hypothesis fails: 47 engineering days.
Assurance earns autonomy
TRUST, GATE and CONTROL are not a governance layer beside AEO. They are the mechanism by which it is allowed to do more.
TRUST — is it independently defensible?
Every AI output is a GENERATED claim until deterministic checks — units, physical envelopes, contract consistency, configuration applicability, evidence reproduction, model agreement — return a verdict: VERIFIED, VERIFIED WITH LIMITATIONS, UNVERIFIED, CONTRADICTED, INSUFFICIENT EVIDENCE, OUTSIDE ENVELOPE, HUMAN REVIEW REQUIRED. Two LLMs agreeing is not verification.
GATE — is it authorised?
A machine-readable authority model says who may propose, approve, execute and who stays accountable, per action class. Twelve policy decision points run before every action; refusals are recorded in a hash-chained ledger, not discarded.
CONTROL — can it execute safely?
Agent Passports and a capability registry bound what an agent may touch, spend and change. Blocked, degraded or unqualified capabilities cannot be invoked autonomously. No physical action is connected.
An agent acts only where earned trust (from verified claims, completed loops and detected attacks) and delegated authority both cover the consequence of the action. Assurance debt records every obligation created when speed is bought with assumptions — and demo evidence is never silently promoted to certification evidence. The red-team panel injects thirteen attacks — fabricated evidence, stale configuration, wrong units, prompt injection, permission escalation, circular AI verification, physically impossible answers — and shows which mechanism caught each one.
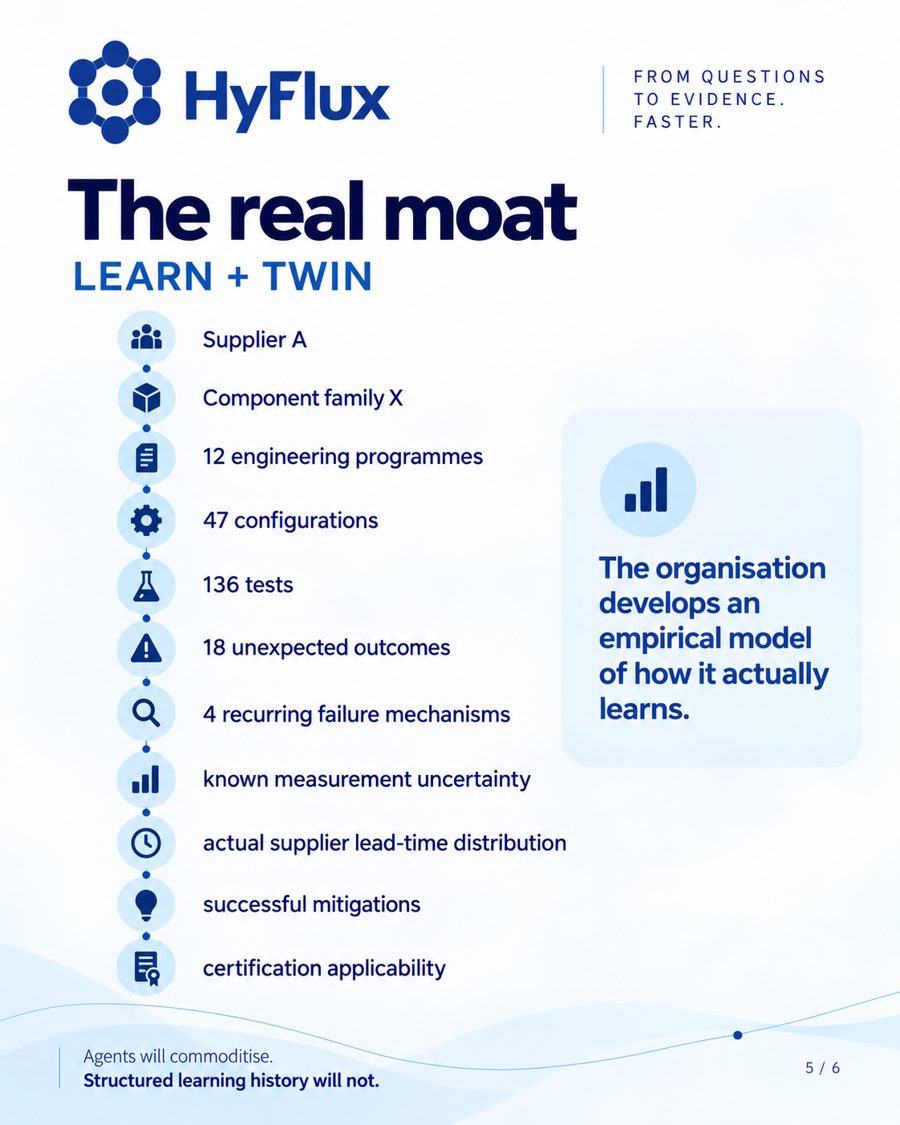
The real moat
LEARN + TWIN
- Supplier A
- Component family X
- 12 engineering programmes
- 47 configurations
- 136 tests
- 18 unexpected outcomes
- 4 recurring failure mechanisms
- known measurement uncertainty
- actual supplier lead-time distribution
- successful mitigations
- certification applicability
Eleven modules, one graph
The control room is a working integrated prototype over one deterministic domain model.
Read the deck
From questions to evidence. Faster.
Walk one full loop: propose a route, approve it, commission, test, verify, decide, learn.
Try the demo → Sign in